Data Source and Data Construction:
1. Quarterly data on aggregate consumption and corporate earning: We use consumption on nondurable and services and corporate profit before tax with IVA and CCAdj, the price deflator is implicit price deflator for nondurable and service consumption. See Hansen, Heaton and Li (2005) for details.
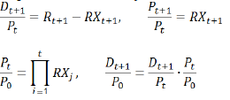
where Rt+1 and RXt+1 are monthly portfolio returns with and without dividends. Hence we’ve got the dividends and prices series subject to choice of initial price. The choice of initial price is not essential to our results and we choose P0 such that for each portfolio quarterly dividends in 1947Q1 is same as personal consumption of nondurable goods and services.
Reference:
Code List:
Last updated: May 15, 2008
1. Quarterly data on aggregate consumption and corporate earning: We use consumption on nondurable and services and corporate profit before tax with IVA and CCAdj, the price deflator is implicit price deflator for nondurable and service consumption. See Hansen, Heaton and Li (2005) for details.
- http://www.bea.gov/national/nipaweb/Index.asp
- Data range: 1947Q1 -2007Q4.
- http://mba.tuck.dartmouth.edu/pages/faculty/ken.french/data_library.html
- http://wrds.wharton.upenn.edu/ds/crsp/msf/m_market.shtml
- Data Range: July 1926-December 2007, monthly
- Note: In Hansen, Heaton and Li (2008), we follow Davis, Famm and French (2000) to construct monthly return with and without dividends for 5 B/M portfolio from the firm level data downloaded from CRSP at WRD. The data range is from 1947Q1-2005Q4. cashflowffcusipcs.txt and returnffcusipcs.txt contain all the data necessary for our calculation.
- Data Range: July 1926-December 2007, quarterly
- Step 1: Construct monthly dividend series.
where Rt+1 and RXt+1 are monthly portfolio returns with and without dividends. Hence we’ve got the dividends and prices series subject to choice of initial price. The choice of initial price is not essential to our results and we choose P0 such that for each portfolio quarterly dividends in 1947Q1 is same as personal consumption of nondurable goods and services.
- Step 2: convert monthly data on return, prices and dividends to quarterly return, price and dividends series
- Step 3: Take 12-month trailing average to get rid of seasonality in the dividends series.
Reference:
- Davis, James L., Eugene F. Fama and Kenneth R. French. "Characteristics, Covariances and Average Returns: 1929-1997." Journal of Finance 55 (2000), 389-406.
- Fama, Eugene F. and Kenneth R. French. "Disapprearing dividends: Changeing firm Characteristics or Lower Propensity to Pay" Journal of Financial Economics 60 (2001), 3-43.
- Hansen, Lars P. and John C. Heaton and Nan Li. “Intangible Risk” (2005) In C. Corrado, J. Haltiwanger, and D. Sichel (Eds.), Measuring Capital in the New Economy, University of Chicago Press.
- Hansen, Lars P. and John C. Heaton and Nan Li. “Consumption Strikes Back? Measuring Long-Run Risk” (2008), Journal of Political Economy 116 (2008), 260-302.
Code List:
- loaddata.m: loads raw data, constructs quarterly cash flows and produces longrun.mat, which is a matlab dataset contains all the necessary data for the computation. The raw data used are:
- From NIPA: Section1ALL_xls.xls downloaded in April, 2008
- Consolidated from Kenneth French’s website: FFBMPORT.xls, downloaded and created in March, 2008
- From CRSP: marketindex_mon.txt and CRSP_TR_mon.txt, downloaded in March, 2008.
- returnweb.m: This program estimates one-period expected return using VAR in [ct-ct-1, et-ct].
- Results: Table 1 and Figure 1.
- cedpriceweb.m: This program calculates long-run price in general case of IES NOT equal to 1.
- Results: Figure 2, Figure 6, Figure 7 and Table 2.
- ceirweb.m: This program estimates the dynamics of consumption and earning system, calculate long-run price in case of IES = 1.
- Results: Figure 3 and Figure 5
- cedirweb.m: This program estimates dividends dynamics in alternative specifications.
- Results: Figure 8
- cedsimweb.m: This program simulates the posterior distribution in the VAR where dividends from individual portfolios are included.
- Results: Figure 4 and Table 3(except last row)
- cedsimweb2.m: This program simulates the posterior distribution in the VAR where dividends from both portfolio 1 and portfolio 5 are included.
- Results: Table 3(last row)
- Auxiliary functions: (Please download these functions to the same directory as the above codes are stored)
- DISCSUM.m: This function calculates finite sum of discounted matrix
- MLEVAR.m: This function estimates VAR system using MLE.
- MLEVARGC.m: This function estimates VAR systems with Granger Causality restrictions
- VALUEFUNC1.m: This function solves value function (v1) and derivative of value function (dv1) with respect to IES when IES =1
- VALUEFUNC.m: This function solves value function for general case when IES not equal to 1.
- SDF1.m: This function solves stochastic discount factor (SDF) when IES = 1.
- DSDF1.m: This function solves derivative of SDF with respect to IES at IES =1
- SDF.m: This function solves SDF when IES not equal to 1
- PRICEOPEBAR.m: This function calculates dominant eigenvalues and eigenfunctions of pricing operator for general case when IES not equal to 1.
- PRICEOPE1.m: This function gives the recursion of pricing operator when IES = 1
- PRICEOPE.m: This function gives the recursion of pricing operator for general case when IES not equal to 1.
- RETOPE.m: This function calculates the long-run risk free rate and price of risk
Last updated: May 15, 2008
| codes.zip | |
| File Size: | 522 kb |
| File Type: | zip |
| cashflowffcusipcs.txt | |
| File Size: | 143 kb |
| File Type: | txt |
| returnffcusipcs.txt | |
| File Size: | 132 kb |
| File Type: | txt |